





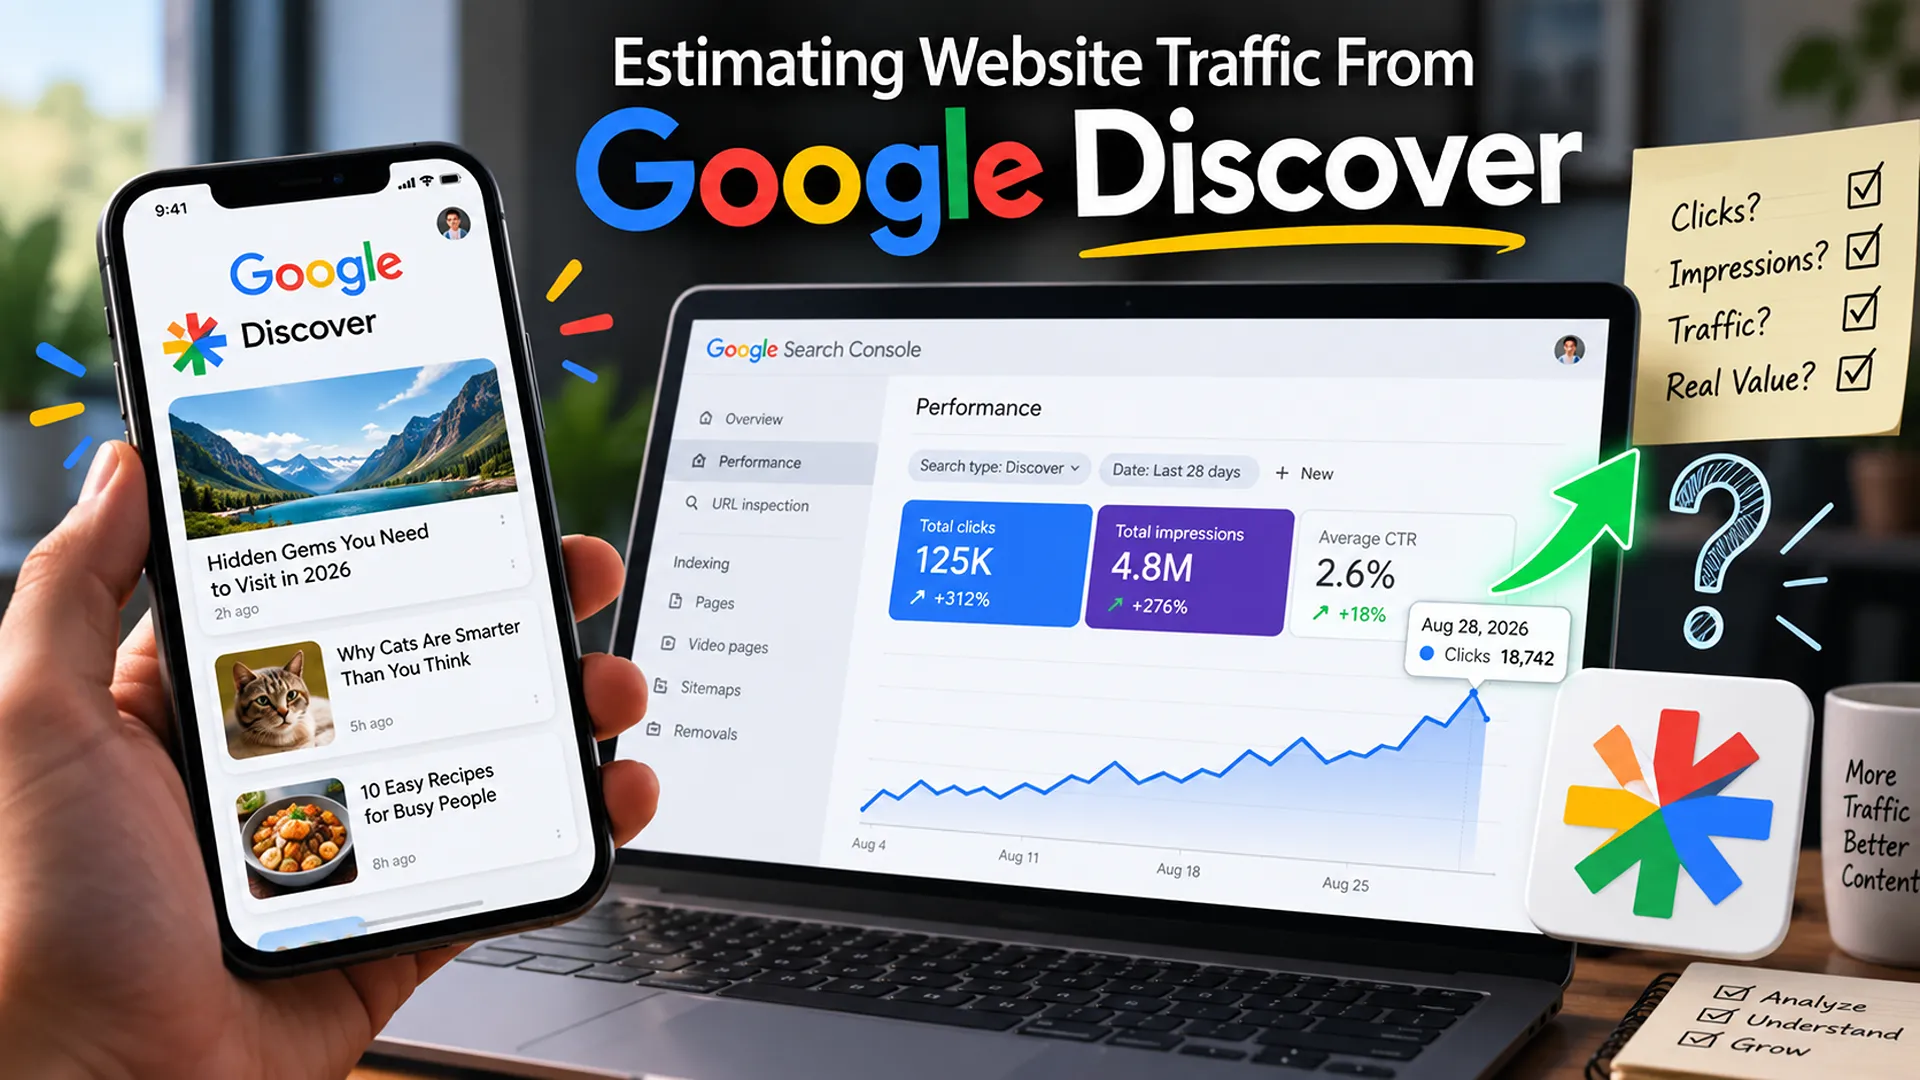
Google reported that more than 800 million people used its interest-based feed each month in 2018, before the product became known as Discover. Today, Search Console gives eligible sites up to 16 months of Discover performance data. That is a large potential audience and a useful reporting window, but neither makes Discover traffic easy to predict.
Discover works without a typed query. It recommends articles, videos and other content according to a person’s interests, activity and context. A page can receive a sudden burst of exposure, then return to its normal traffic level just as quickly.
This makes estimation more useful than false precision. Search Console can tell you how many Discover impressions and clicks Google counted. Your analytics platform can tell you how many measured sessions and users reached the site. Those figures describe related events, not identical events, so a reliable estimate needs both.
Think of a Discover card as a shop window. An impression means the card came into view, while a click means someone chose to enter. The click is therefore your strongest platform-level estimate of a visit attempt.
Search Console counts a Discover impression when an item is scrolled into view. If the same person scrolls away and back to that item during the same session, Google does not count another impression for that repeated view. A click is counted when the person selects the item, but sharing it or taking another action is not a click.
Click-through rate, usually shortened to CTR, is clicks divided by impressions. If an article records 200,000 impressions and 6,000 clicks, its Discover CTR is 3%.
That does not automatically mean your analytics platform will show 6,000 sessions. A click records an action in Discover. A session normally requires the destination page to load far enough for your analytics code to run and for measurement rules to accept the event.
Several things can prevent that match:
For that reason, treat Discover clicks as estimated outbound visit attempts. Treat analytics sessions as measured on-site visits. Treat users as people or devices deduplicated according to your analytics platform’s identity rules.
| Metric | What it measures | Best use |
| Discover impressions | Cards scrolled into view | Understanding exposure |
| Discover clicks | Selections of a Discover item | Estimating visit attempts |
| Analytics sessions | Measured visits after the page starts loading | Evaluating on-site behaviour |
| Analytics users | Deduplicated visitors under the chosen identity method | Estimating audience reach |
A useful working metric is the click-to-session reconciliation ratio:
Suppose Search Console reports 10,000 Discover clicks during a campaign window and your reconciled analytics segment contains 8,400 sessions. The observed ratio is 84%. If similar content, tracking and markets have produced a stable ratio, you can use it to create a central estimate for another exposure period.
This ratio is not an official Google metric. It is an internal diagnostic. Its purpose is to expose measurement differences rather than make missing sessions disappear.
You should also avoid turning clicks into an estimate of unique people. A reader can click more than one Discover card from your site, revisit the same article or return on another day. If reach matters, report clicks, sessions and users separately.
Page-level Discover data is a bit like mail sorted by the official address rather than the door where it was delivered. Search Console assigns Discover performance to the canonical URL, which is the version Google considers representative. That may not be the exact URL a visitor reaches after clicking.
This matters when your site uses duplicate paths, tracking parameters, mobile variants, syndicated copies or inconsistent canonical tags. Search Console may credit the canonical article while GA4 records a parameterised or redirected landing page. A raw URL comparison will then understate the match.
Start by exporting Discover performance grouped by page. Normalise the URLs before comparing them with analytics data:
The Discover table is limited to 1,000 rows, and low-volume rows may be hidden by reporting thresholds even though they contribute to the property total. Do not assume that adding every visible row will reproduce the headline click total.
For a small set of priority pages, estimate visits directly:
Imagine a guide receives 4,500 Discover clicks. Similar articles on the same template average an 88% click-to-session ratio. Your central estimate is 3,960 visits. A reasonable reporting range might use the lower and upper ratios observed across comparable pages rather than an arbitrary percentage.
Compare these estimates with broader website traffic to see whether Discover created incremental reach or merely coincided with a wider increase from Search, social, email or direct visits. The property total alone cannot tell you which landing pages converted attention into useful engagement.
Page grouping makes the analysis much more practical. Instead of judging every URL independently, create cohorts such as breaking news, evergreen guides, product explainers, videos or seasonal features. Compare median CTR, typical exposure duration, click-to-session ratio and post-click outcomes across those groups.
| Page-level field | Why it matters |
| Discover clicks | Estimates visit attempts from the feed |
| Discover impressions | Shows the scale of exposure |
| Discover CTR | Indicates how often visible cards earn clicks |
| Measured sessions | Shows visits captured on the site |
| Engaged sessions | Helps distinguish meaningful visits from quick exits |
| Conversions or key events | Connects exposure with business value |
Discover exposure often behaves more like a wave than a steady river. An article can move from almost no Discover activity to a sharp peak, then fade as interests, competition and recommendation patterns change.
Use the shortest reporting interval that matches your question. The 24-hour Search Console view is useful for investigating a current spike, but its newest points can be preliminary. Daily data shows the shape of a multi-day exposure. Weekly or monthly views smooth the noise when you want to compare longer periods.
A simple exposure analysis has four stages:
To estimate incremental visits, subtract the expected baseline from the exposure period. Suppose a page normally receives 40 Discover clicks per day. It then records 5,600 clicks across seven days.
If the observed click-to-session ratio for comparable pages is 85%, the central estimate of incremental visits is 4,522. Label the calculation as an estimate and keep the raw clicks beside it.
Baseline selection deserves care. The previous seven days may be distorted by a weekend, holiday or earlier spike. For seasonal subjects, the same period last year may be more informative. For new content, a page-level baseline may not exist, so use a comparable content cohort instead.
Do not forecast Discover as though it were keyword search demand. Google itself describes Discover traffic as less predictable than query-driven Search traffic. User interests shift, the mix of content changes and Search system updates can alter exposure even when you publish at the same quality and frequency.
Treat a spike as supplemental reach, not guaranteed recurring inventory. Use it to learn which subjects, images and formats attract qualified readers, then strengthen the pages that keep them engaged. Avoid clickbait and exaggerated headlines: a misleading card can damage trust even when it wins the initial click.
A global Discover total can hide several very different audiences. Country and device analysis shows where exposure happened and how those visitors experienced the site.
Search Console’s Discover report lets you group and compare performance by country. Start with clicks, impressions and CTR, then calculate each country’s share of total clicks. This separates a market that contributes a large audience from one that merely has a high CTR on limited exposure.
For example, Country A might generate 60% of impressions but only 45% of clicks. Country B might account for 15% of impressions and 25% of clicks. The second market has stronger relative response, but you still need analytics data to see whether those visitors engaged or converted.
Country is based on where Discover was viewed or clicked, not necessarily the person’s nationality or preferred market. Travel, network routing and location settings can complicate interpretation. Use the dimension for market patterns, not personal identity.
Device reporting needs a different approach. The current Discover report documentation focuses on page, country, date and appearance groupings, so do not assume that every property will show a dedicated device table. Use GA4’s device category for measured sessions, then align the date range and landing-page set with Discover clicks.
Most Discover use happens in a mobile context, but you still should not invent a mobile percentage. Measure your own audience. If analytics shows mobile, tablet and desktop sessions, report those as the device mix of measured visits associated with the exposure window, not as a perfect device breakdown of every Search Console click.
| Pattern | Possible explanation | What to check |
| High country CTR, weak engagement | The card attracts attention but the page misses local expectations | Language, examples, pricing and page speed |
| Strong clicks, low measured sessions | Tracking or loading losses may be higher in that market | Consent, connection speed and redirects |
| Mobile sessions dominate but conversion lags | The journey may be awkward on a small screen | Forms, navigation, intrusive elements and checkout |
| One country spikes briefly | A local event or trend may have triggered interest | Timing, topic relevance and referral context |
| Country totals do not match visible page rows | Thresholds or table limits may hide detail | Property totals, exports and row coverage |
Time zones can shift comparisons. Outside the 24-hour view, Search Console dates use Pacific Time, while GA4 may use the property’s configured time zone. A fast Discover spike near midnight can therefore fall on different calendar dates in the two systems.
Check that images remain clear on mobile and survive a landscape crop. If a page serves only one market, make that scope obvious before the click.
Search Console and GA4 look at the same journey from opposite sides of the door. Search Console records what happened on the Google surface. GA4 starts measuring after the visitor reaches your site and the tracking setup responds.
This difference explains why the numbers rarely match exactly. Neither tool is necessarily wrong. They count different events under different rules.
Search Console is the authoritative source for Discover-specific impressions, clicks and CTR. GA4 is the better source for sessions, engagement, users and outcomes after arrival. Standard GA4 acquisition reports may place Discover visits within broader Google organic or referral-related groupings rather than presenting a clean Discover channel.
Several limits affect attribution:
A practical report should preserve these differences rather than forcing one number to win. Use four layers:
| Reporting layer | Recommended measure |
| Platform exposure | Discover impressions and CTR |
| Visit attempts | Discover clicks |
| Measured on-site activity | Reconciled sessions and users |
| Business outcome | Engagement, subscriptions, leads, sales or another relevant action |
For planning, add a range. The conservative estimate can use measured sessions. The central estimate can apply a stable historical reconciliation ratio to Discover clicks. The upper estimate can use raw clicks as visit attempts, provided you label them clearly and do not present them as confirmed sessions.
Suppose Search Console reports 20,000 clicks. Analytics captures 16,200 matching sessions, and comparable periods usually produce an 82% to 87% reconciliation ratio. Your report might show 16,200 measured sessions, a central estimate of roughly 16,900 visits and 20,000 platform clicks. Each figure answers a different question.
Do not hide the gap. Investigate it. If the ratio suddenly falls from 85% to 60%, check site speed, redirects, tag deployment, consent behaviour and server errors before blaming Discover quality.
Keep the final report transparent. State the date range, time zone, property, filters, page rules, analytics segment and calculation method. If table rows do not cover the whole property total, say so.
Judge the traffic by what readers do after arrival. A smaller exposure that brings relevant readers back can be worth more than a dramatic spike with no engagement.
Build a repeatable dashboard that places Discover clicks beside measured sessions, landing pages, countries, devices and outcomes. Once the definitions stay consistent, you can estimate traffic honestly, spot tracking problems faster and make better decisions without pretending the channel is more predictable than it is.